Install and Configure the Cloud Watch Logs Agent on a Running EC2 Linux Instance
What is Cloud Watch?
Cloud watch is a monitoring service to monitor your AWS resources,
as well as the applications that you run in AWS. So the cloud watch basically monitors performance. Performance monitoring and cloud watch can monitor things like compute. Inside the compute, it can monitor things like our
EC2 instances, Auto scaling groups, Elastic Load balances, and Route 53 health checks. Cloud watch can go through and not just monitor the EC2 instances it can monitor a whole bunch of other things as well. It can monitor storage and content delivery, our EBS volumes we can monitor how busy the volumes are we can monitor storage gateways and we can monitor cloud front using cloud watch as well.
Cloud watch Pricing
It is Free
Scenario-:
Install and Configure the CloudWatch Logs Agent on a Running EC2 Linux Instance
To do this you have to log in to your Amazone account
Before Enable the Cloudwatch we have to do a few things
We have to create a Policy
We have to create a Role
Attach the IAM role To the EC2 Instances
Creating a Policy
To Create a Policy we have to go to the IAM
In IAM from the left side, panel select Policy tab to Create a new Policy
Click Create Policy
In Policy Window Select JSON tab and add the below JASON Policy
JASON
{
"Version": "2012-10-17",
"Statement": [
{
"Effect": "Allow",
"Action": [
"logs:CreateLogGroup",
"logs:CreateLogStream",
"logs:PutLogEvents",
"logs:DescribeLogStreams"
],
"Resource": [
"*"
]
}
]
}
Click Revie Policy
In the Review policy window adds the Name and Description for the Policy.
Note -: You can use any name that you like
Create Policy
After Creating the Policy you will be able to see the Policy that you have created
Creating a Role
In IAM from the left side, panel select Role tab to Create a new Role
Click Create Role
In the Creating Role Window
Select AWS services and select EC2
Click Permissions
In the Permissions Window Select the Policy That you have created Earlier
In here Permission will be granted from the policy
Click Tag
In the Tag Window, You can give a Tag for the Role in my case I gave as
Key -: Name
Value(Optional) -: CloudWatchLogAgent
Click Review
In the Review window, you can give a Name to your Role
I gave the same name as it was in the Tag
After Creating the role you will be able to see your role
Attaching an IAM Role to a Instances
Attach the IAM role and add the Details
IAM Role Select the Role That you have Created in the Role
Install and Configure the CloudWatch Logs Agent
To Install the Cloud watch agent we have to log in to our Instances
Use the Putty and your Public IP to log in to your Instances
After logging to the Instances use the Below Commands to Install the Cloud Watch Agent
Fist Update your Instances
sudo yum update -y
Install the AWS Logs
sudo yum install -y awslogs
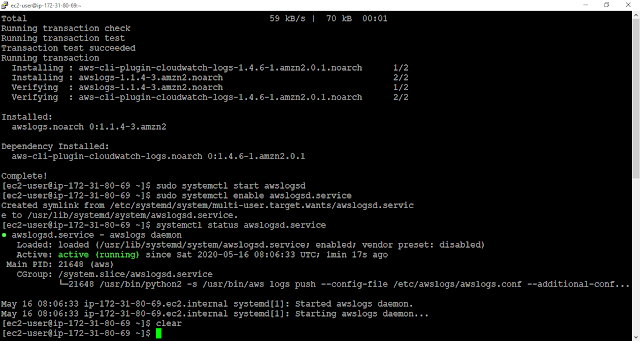
Start the AWS Log Services
sudo systemctl start awslogsd
Check the Logservicese Status (It should be active (running) )
sudo systemctl status awslogsd.service
Enable the Logservicese at each boot
sudo systemctl enable awslogsd.service
Note -: By default, the /etc/awslogs/awscli.conf points to the us-east-1 region, if you are in a different region edit the awscli.conf and add the Region that you are in. You can check your Region in top Right Conner
Check the Cloud watch Logs
To Check the Log we have to go to the Cloud Watch
Services under Management & Governance select Cloud Watch
Click Logs on the left to view the logs
Here it will show the Path that the Instance Log file is saved in
Click on the Path (/var/log/messages)
When you click on the Path you will be able to see the log file
Select the Log file and click it
This is the in datil of the Log file you can use filter events to Filter the Log
For instance, you can usee Keyword Erro to filter all errors.
Real-world Example
Using Cloud watch we can monitor the Instances log and we can have a good idea about our instance such if there are errors in that we can easily motor those using cloud watch. Moreover using these we can monitor the security issues that we are facing such as if someone has tried to hack our Server we will be able to see how many times have they tried etc..
References -:
Create Elastic Load Balancing and Auto Scaling Group
What is a Load Balancer?
The load balancer is exactly what it sounds like It is a physical or virtual device that's designed to help you balance the load balance the network load across multiple web servers. if we've got a load balancer HTTP web server One, Two webserver Three, etc. It can balance the load across the three of them. You can also use it for applications it doesn't have to necessarily be Internet-facing load balances. but typically they are Internet-facing and primarily they're used to balance load across web servers.AWS has three different types of load balances
Load balancers Type
Application load balance (Intelligent Layer 7)
Network load balancer (Extreme Performances Layer 4 )
Classic load balancer (Basic Load balancers with Low Cost)
Create load balancer with Autos scaling group
To do this you have to log in to your Amazone account
Creating an Image from the Existing Instances
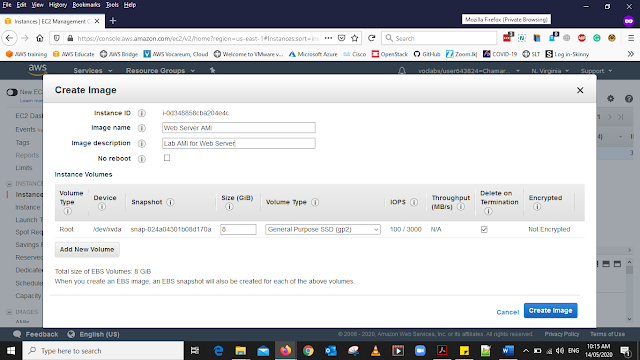
First of all, we are going to create an Image from the existing Instance then they both will be identical.
To do that go to the Ec2 instances and select the Web Server 1 then got to Action and Select Create Image and give the detail as below then Select Crate Image
Image name: Web Server AMI
Image description: Lab AMI for Web Server
Creating a Loadbalancer
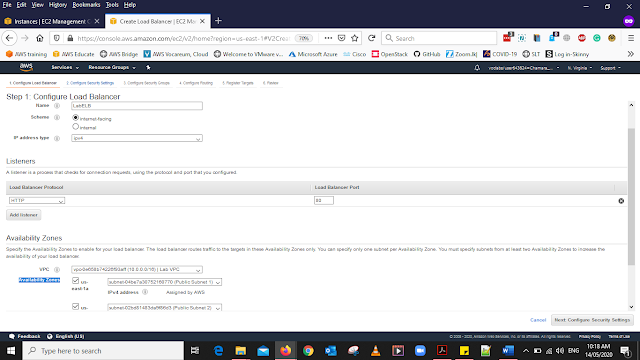
Select Loadbalancer form the left side panel then Click Create Loadbalance.
You will get a three options namely -: Application Load Balancer, Network Load Balancer, Classic Load Balancer
For this Lab, we will select Application Load Balancer and add the details below
Name: LabELB
VPC: LabVPC
Availability Zones: Add the Both availability subnets
Click Configure Security Settings
In the Security Settings
Select the Existing Security Group
From the list Select Only the Web SecurityGroup
Click Configure Routing
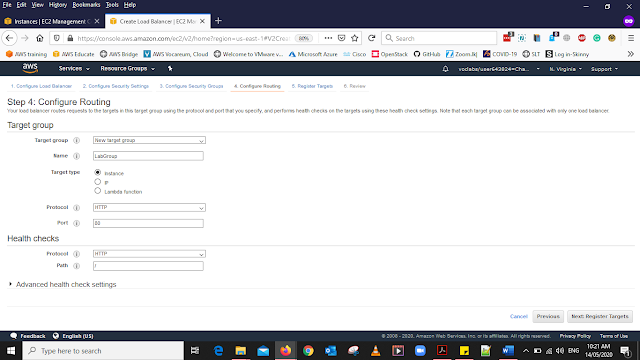
In the Routing add the Details as below
Name: LabGroup
Keep all the setting as the default
Click Register Targets
In the Register Targets, you don't want to select anything just keep this setting as the default
Click Review and select Create
Configuring the Auto Scaling Group
Here we are going to create the Configurations for the Auto Scaling this going to be the other scaling instances
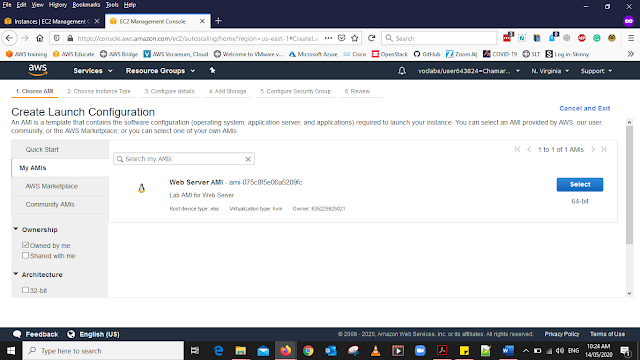
Form the left side of the panel select Launch Configurations.
Select the Create Launch Configurations. Under AMI select My AMIs Then You will be able to see the Web Server AMI that we have created in the First step of this Lab, Select it
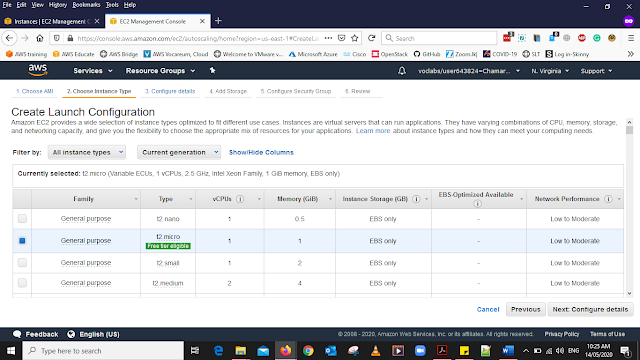
In Instance Type select
Instance Type as- t2.micro (It will be the default selected Instances)
Note: If you have launched the lab in the us-east-2 Region, select the t3.micro instance type
Click Configure details
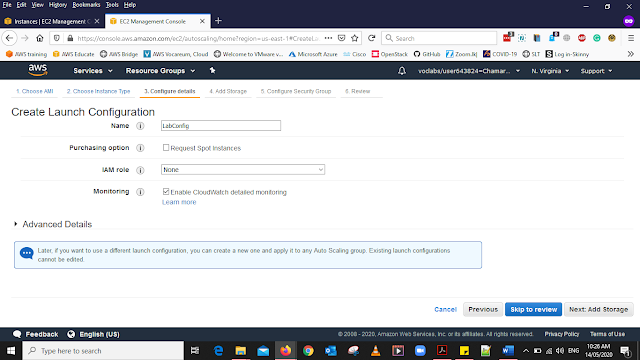
Add the details as Below for the Configure details Select Add Storage
Name: LabConfig
Monitoring: Put the Tick for Enable CloudWatch detailed monitoring
In the Add, Storage keep the storage settings as the default
Click Configure Security Group
In the Security Settings
Select the Existing Security Group
from the list Select Only the Web SecurityGroup
Click Review
After Clicking the Review In the next window
Click Create Launch Configuration
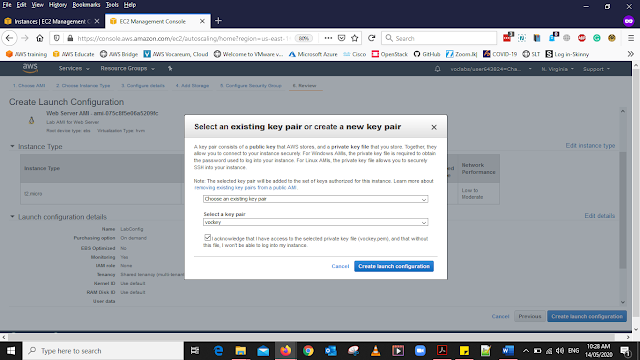
Then It will ask for the Key Pair select
Existing key pair from the Dropdown List
Give the key pair as vockey
Select Create launch configuration
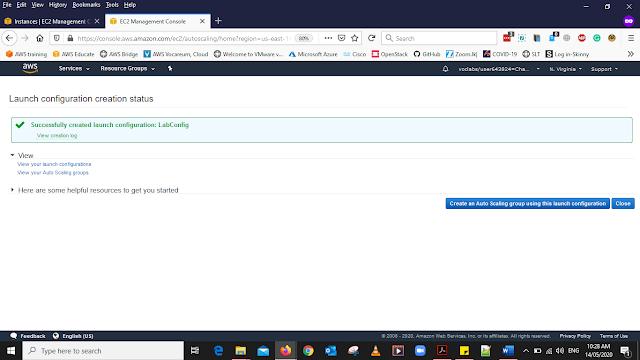
When the instance is created You will geta a message saying
Create an Auto Scaling group using this launch configuration Select this
Note-: Don't Select Close Button
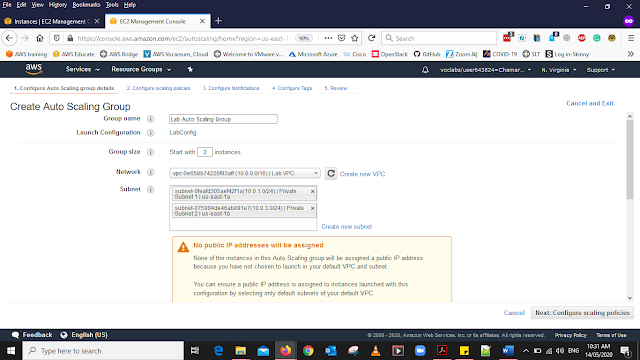
In the Configure Auto Scaling Group Details add the Details as below
Group name: Lab Auto Scaling Group
Group size: 2
Network: LabVPC
Subnets: Private Subnet 1 (10.0.1.0/24) Private Subnet 2 (10.0.3.0/24) This will help EC2 to work in Both AZ
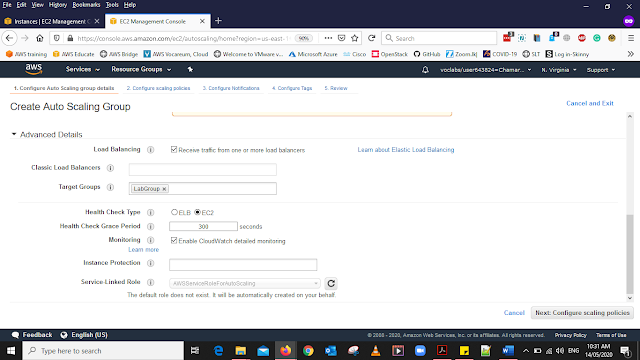
In the same page Under Advanced Details
Add the details as below
Load Balancing: Put the Tick for Select Receive traffic from one or more load balancers
Target Groups: LabGroup
Monitoring: Put the tick for Select Enable CloudWatch detailed monitoring
Click Configure scaling policies
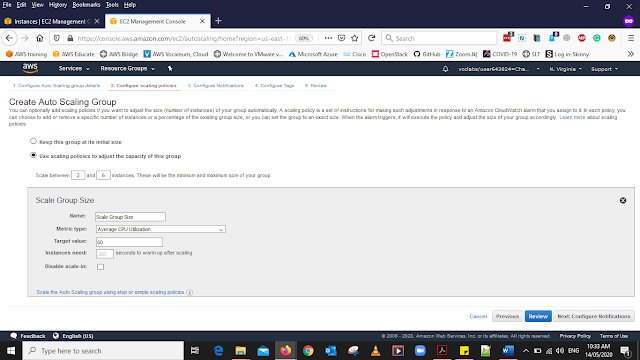
In the scaling policies, Select Use scaling policies to adjust the capacity of this group. and add Scale between 2 and 6
In Scale, Group Size Add the details as below
Metric type: Average CPU Utilization
Target value: 60
Click Configure Notifications
In the next window Configure Notifications
Keep the default Notification setting as it is
Click Configure Tags
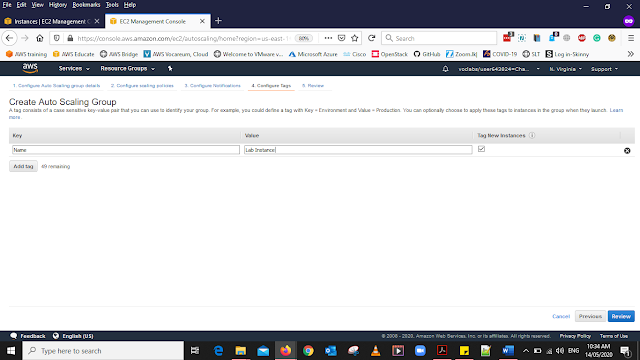
In the Tag add the details as below
Key: Name
Value: Lab Instance
Click Review
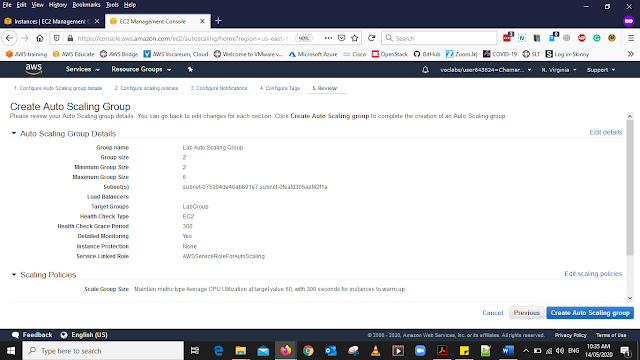
Here You will be able to see the datils of your Autoscale Group
Click Create Auto Scaling group
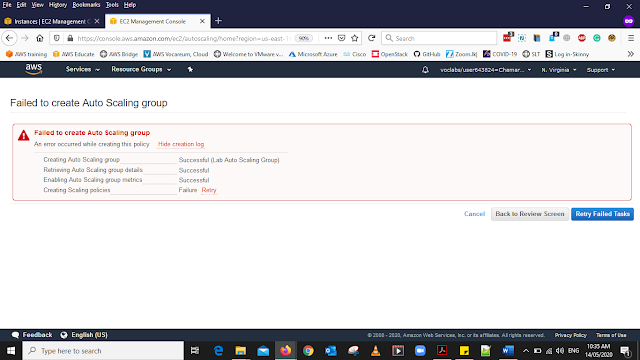
At the First time When you Click the Create Auto Scaling group, You will get this message
Click Retry Failed Tasks
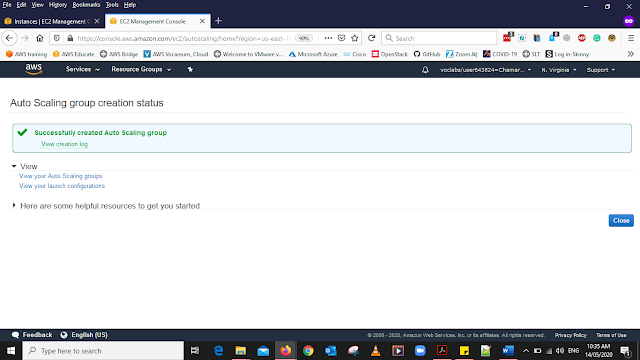
After CLicking the Retry Failed Tasks it Should Successful then Click Close
Verify that Load Balancing is Working
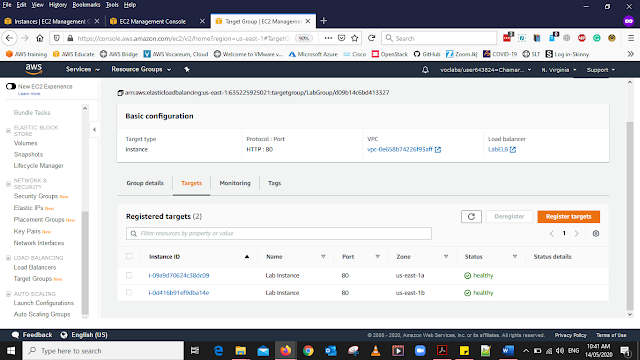
Select Target group form the left side panel, you will be able to see the Group name call LabGroup Click that one and after clicking that you will get this window. In this window select the Targets tab then you will be able to see the health of the targets The Two Targets Status Should be Healthy.
Note -: In the Instances, you should see two new instances named Lab Instance
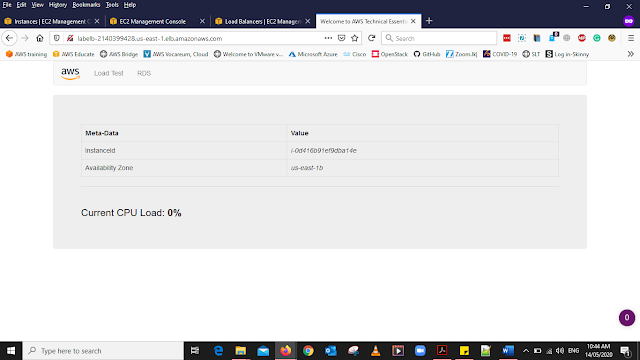
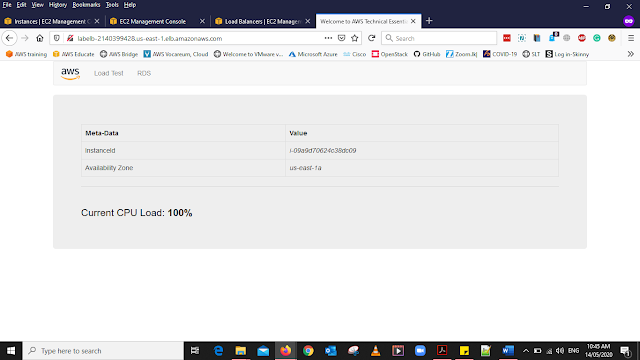
Select Loadbalancer form the left side panel and select LabELB in the under the description menu (bottom of the window) get the DNS name of the Loadbalancer open a new tab in your Web Browser and paste the copied link then you will be able to see a web page as above.
Note-: If You Noticed carefully When you Click the AWS Log, The Availability Zon will change between (us-east-1a and us-east-1b) when the page is refreshed. This means the load is balanced between two AZ.
Test Auto Scaling
To test the Auto Scaling We are going to use Cloud Watch Services
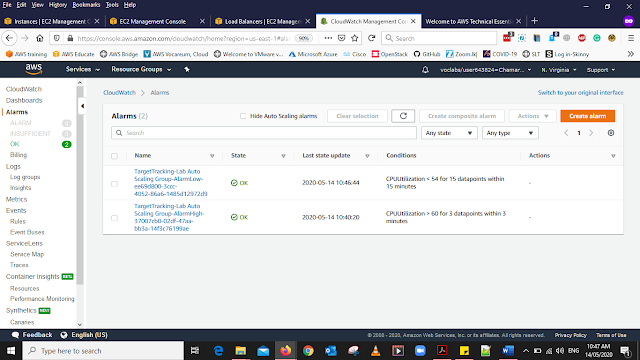
In the services Under Management & Governance Select CloudWatch
From the left panel, click Alarms Then You Should be able to see the details as above
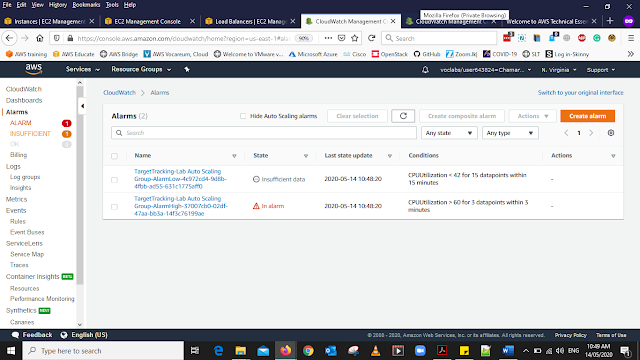
When The page is Loaded to the page You will be able to see the Alarms has been triggered
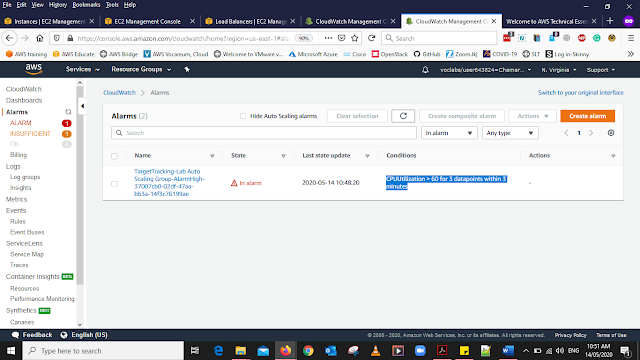
In this Alarm, it shows that CPUUtilization>60 for 3 datapoints within 3 minutes
This means that the Intncase is overload and now it will autoscale and it will add more Instances.
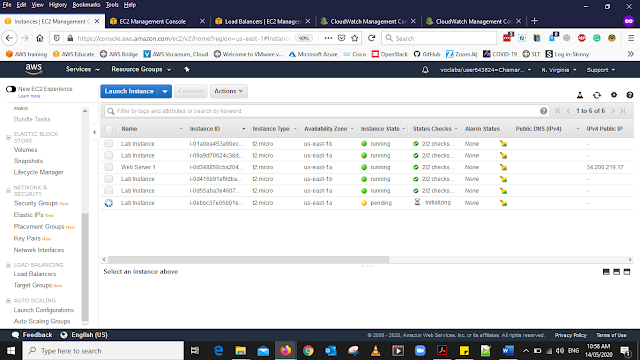
In the Instances, you will be able to see the newly added Instance for Autoscaling
What are the benefits and real-world example
If we think that we have a ticketing Web site and when the season comes it's peaking. So, for those days only, we need to balance our load on the Web. For this kind of situation, we can create load balancers in Multiple AZ when the load hits the web site it will balance the load across the AZ. Moreover, using Auto Scaling it will create the Instances it will help the webserver to configure resources automatically depending on requirements. Using these two services we can achieve some great benefits such as Increased Scalability, Redundancy, Reduced Downtime, Increased Performance are a few of them.
References-:
Click hear to Visit my Facebook

 To Create a Policy we have to go to the IAM


 In the Tag Window, You can give a Tag for the Role in my case I gave as


